
A half-barrel keg 'contains' 124 pints — real bars pour closer to 110-118, and the gap is a margin leak
The math on a keg says 124 pints. Foam, spillage, and line waste routinely eat 5-25% of that before it ever reaches a glass — here's the real yield math and what drives the gap.
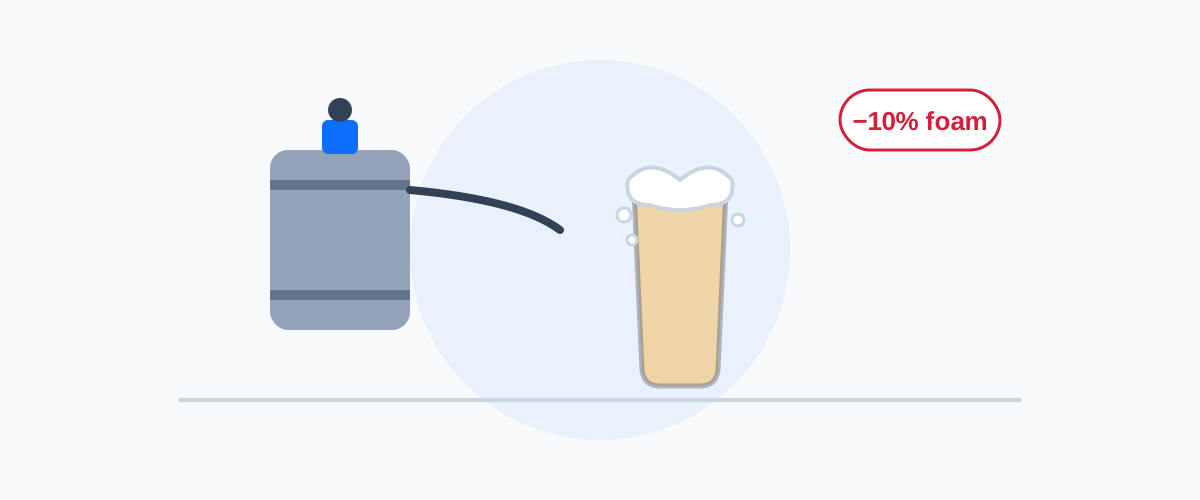
The number on the spec sheet and the number in your P&L are not the same number
A standard U.S. half-barrel keg holds 15.5 gallons (58.7 L) of beer. Divide that by a 16-ounce (473 ml) pint and you get a clean, satisfying 124 pints per keg. Bar managers use that number to cost their pour, price their pint, and forecast how many kegs a busy Friday will burn through.
It’s also almost never the number of pints that actually leave the tap. Foam, spillage, line-cleaning loss, and the unsellable slurry at the bottom of every keg all take a bite before that beer reaches a glass someone pays for — and unlike a bottle or can, where the serving size is fixed at the brewery, a keg’s real yield depends on how well the draft system between keg and tap is running.
The theoretical math, US and European
US half-barrel keg (15.5 gal / 58.7 L):
- 124 pints at 16 oz (473 ml)
- 165 pours at 12 oz (355 ml)
European 50-liter keg:
- 100 pours at 0.5 L
- 166 pours at 0.3 L
These figures come straight from keg capacity specs published in the Brewers Association’s Draught Beer Quality Manual — the industry’s standard technical reference for draft systems. They are the physical maximum. No draft system, however well maintained, hits 100% of it, because getting beer from a pressurized keg through several feet of tubing into a glass without disturbing its dissolved CO2 is a genuinely fussy piece of physics.
What “normal” waste actually looks like
Industry figures on real-world keg yield vary by source and methodology, but they cluster in a consistent range:
- BarTrack, drawing on cumulative data from thousands of draft-monitoring installations, puts the industry average keg yield at 75-80% — meaning 20-25% of a typical keg never becomes a sold pour — with well-run systems losing 5-10% and poorly maintained ones losing 15-25%. Foaming alone accounts for more than 10% of waste per keg on average, and roughly 90% of foaming issues trace back to temperature problems and human error in pouring technique.
- Bar-i, a draft beverage consultancy working with bars across 20 U.S. states, sets the bar higher: a properly optimized system should achieve 95% yield or better (5% waste), while a system with too many tap lines for its sales volume typically settles around 90% yield (10% waste) — and that’s before accounting for any unreported giveaways or comps, which push real losses higher still.
Put those together and a reasonable working range for a decently run bar is 5-10% waste on a well-tuned system, rising to 15-25% on a neglected one — the difference between roughly 112-118 usable pints per keg and closer to 90-105.
What actually drives the waste above normal
The Brewers Association’s troubleshooting guidance for foaming beer — the single biggest cause of pour loss — points to a short list of culprits, nearly all of them maintenance or calibration issues rather than bad luck:
- Temperature out of range. Beer should dispense at roughly 36-38°F (2-3°C). Warmer beer releases CO2 too fast on the way to the glass and foams before the pour even starts; too-cold beer can freeze partially in the lines and cause the same problem when it thaws unevenly.
- CO2 pressure miscalibrated. Most beers dispense correctly at 12-14 psi (0.8-1.0 bar). Too much pressure forces excess gas into the beer, which escapes as foam at the faucet; too little lets the beer go flat and pour slow.
- Line length and diameter mismatched to the system. Draft lines are sized to create resistance that balances the applied gas pressure — a kinked line, wrong-diameter tubing, or a line too short for the vertical rise to the tap unbalances the pour.
- Dirty lines and worn components. Lines need cleaning roughly every two weeks; residue buildup, worn coupler or faucet washers, and a clogged faucet vent hole all cause foaming, on top of the off-flavors dirty lines produce independently.
- A torn keg valve seal or coupler obstruction lets gas leak directly into the liquid stream and foams the beer before it even leaves the keg.
What the waste actually costs
The Siebel Institute of Technology — a Chicago-based brewing and beverage business school — frames the cost simply: roughly one ounce of every four ounces of foam is actual beer, so overflow that gets dumped is liquid product going down the drain. At a $4 retail pint (25 cents an ounce), wasting one extra ounce (30 ml) per pour works out to about $31 in lost retail value per keg — which the Institute scales to roughly $1,600 a year for a bar changing one keg a week, and over $16,000 a year for one changing ten kegs a week. Left open without a glass underneath, a faucet wastes beer at the system’s full flow rate — about 2 ounces (59 ml) per second, since a balanced draft system pours at roughly 1 gallon (3.8 L) per minute.
Draft vs. bottled and canned: cheaper on paper, riskier in practice
Draft beer’s appeal on a cost sheet is real: bottled or canned beer typically costs 40-45% more per ounce than the same beer on draft, and draft commonly runs a pour cost around 20% against roughly 25% for packaged beer. That’s before counting the tap system’s own overhead — CO2, refrigeration, line cleaning, equipment — which packaged beer never carries at all.
That’s the trade-off in one sentence: draft is cheaper per ounce on paper, but every ounce is variable. A bottle or can is a fixed, brewery-sealed serving size — the yield is 100% by definition, every time. A keg’s yield moves with tap temperature, gas calibration, line condition, and staff pouring technique, and a system that’s drifted out of spec can quietly erode that cost advantage, or erase it entirely, without a single line item on an invoice ever changing.
Why this matters for anyone costing a menu
A keg is really just an ingredient with a documented, physics-driven prep loss — no different in principle from a fish that loses weight to trim, or a roast that shrinks on the grill. The theoretical yield is on the spec sheet; the real yield is whatever your system, staff, and maintenance schedule actually deliver. That gap is easy to build into a recipe cost once and never revisit — until a slipping draft system quietly turns a 20% pour cost into something worse.
How CalcMenu helps
CalcMenu’s core mechanic — tracking actual usable yield against theoretical yield for any ingredient — applies directly to a keg the same way it applies to any ingredient with prep loss or waste:
- Yield-based recipe costing — set a realistic keg-to-pint yield (not the 124-pint theoretical maximum) so your actual pour cost per beer reflects what really comes out of the tap, not what the spec sheet promises.
- Live ingredient cost tracking — when a distributor’s keg price moves, every recipe and pour-cost calculation using it updates immediately, instead of drifting out of date until someone notices at month-end.
- Portion and waste visibility across the menu — see which beverage lines are running below their expected yield so a drifting draft system shows up as a cost signal, not just a vague sense that “the keg didn’t last as long this week.”
CalcMenu doesn’t recalibrate your CO2 regulator or clean your beer lines — that’s still a technician’s job. What it does is make sure that once you know your system’s real yield, that number is the one driving your pour cost and your pricing, not the theoretical one on the keg label.
Related reading
- Pour cost 101 covers the same 20%-target math that draft beer yield directly feeds into
- Cocktail garnish and ice waste is the same “recipe card vs. real cost” gap, just on the other side of the bar
- Espresso dial-in shows the same deliberate-waste-for-quality trade-off, on a much smaller and pricier scale
Want to see what your bar program is really costing you? Book a free 15-minute call with our team — no commitment: Schedule a call.
Sources
- Brewers Association — Draught Beer Quality Manual, 2nd Edition (keg capacity specs, serving temperature, CO2 pressure, foaming troubleshooting)
- Bar-i — What Is the Normal Waste Level for Draft Beer?
- BarTrack — Draft System Troubleshooting: How to Fix Foamy Beer
- Siebel Institute of Technology — How Much Does Wasting Draught Beer Cost a Retailer?
- SC Beverage — How to Price Draft vs. Bottled Beer
Related sectors
Comments
Comments coming soon.