
Profitability #1 — Food cost fundamentals: theoretical vs actual, and where the gap hides
Two food cost reports for the same kitchen, the same week — 29% and 32.5% — and neither one is wrong. Theoretical and actual food cost measure two different things by design. What each number actually calculates, what gap size is normal, and the real (non-accounting) reasons it grows.
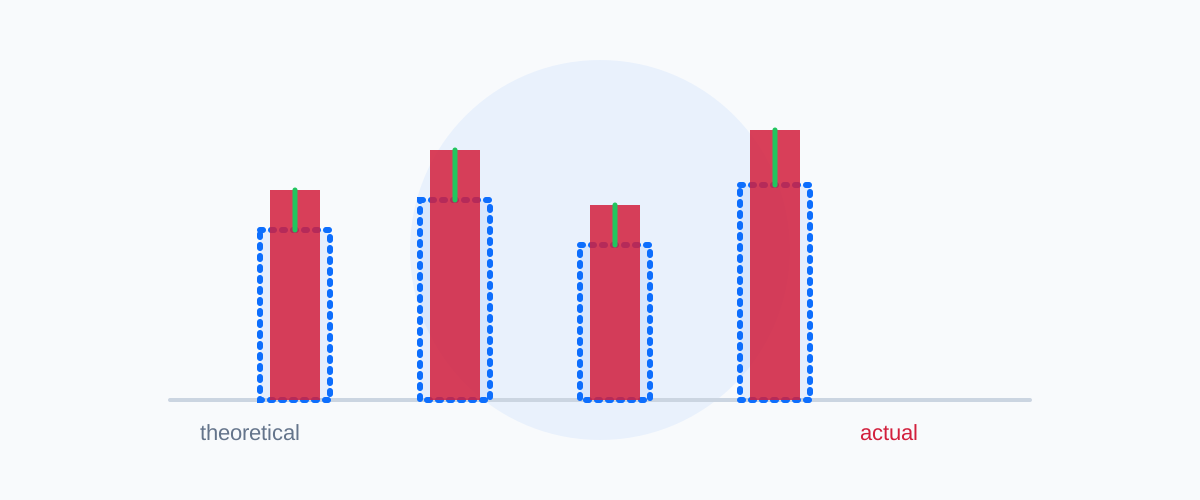
Two food cost percentages, same week, same kitchen — and both are right
A general manager pulls two reports for the same seven days. Theoretical food cost: 29%. Actual food cost: 32.5%. The instinct is to assume one of them is wrong — a bad recipe cost, a bookkeeping error, something to track down and fix. Usually, neither is wrong. They are answering two different questions, and the gap between the answers is not a mistake. It is the single most useful number a kitchen produces, if you know how to read it.
What theoretical food cost actually calculates
Theoretical food cost is built from the bottom up, entirely from data you control: the recipe. Cost each dish from its ingredients at current supplier prices, multiply by units sold, sum it across the menu, divide by food revenue for the period.
Theoretical food cost % = Σ (recipe cost × units sold) ÷ total food revenue
It answers one question: if every dish had been made exactly to the recipe card — correct portion, correct yield, zero waste, zero error — what would food cost have been? It’s a forecast, not a measurement of what actually happened in the kitchen.
What actual food cost actually calculates
Actual food cost is built from the top down, from physical stock movement: opening inventory, plus purchases, minus closing inventory, divided by food revenue for the same period.
Actual food cost % = (opening stock + purchases − closing stock) ÷ total food revenue
It answers a completely different question: however much food-dollar value physically left the building this period, how much revenue did it produce? It doesn’t care why the food left. Sold correctly to a paying guest, over-portioned by a line cook, spoiled in a walk-in, given away as a comp, trimmed away in prep beyond the recipe’s assumed yield, stolen — every one of those counts identically in this number. Actual food cost is indifferent to cause; theoretical food cost has no concept of cause at all, because in theoretical food cost nothing ever goes wrong.
The gap is not a bug — it’s a diagnostic
Because these are two structurally different calculations, a gap between them is expected in every kitchen that has ever operated. The real question isn’t “why is there a gap.” It’s “is this gap the right size, and is it growing.”
There’s no single, universally agreed number for the right size — industry benchmarks vary by source, and it’s worth treating any single figure as a rough anchor rather than a rule. Restaurant365’s own product documentation cites a typical target range of 1.5–2.5 percentage points of variance between theoretical and actual food cost; food-costing platform meez frames it in bands — under 2 points as well-managed, 2–3 as acceptable, 3–5 as common but in need of attention, and above 5 as a systemic problem. For a sense of scale on the national aggregate: the National Restaurant Association’s 2024 data put median food-and-non-alcohol-beverage cost at 32.0% of sales for full-service restaurants and 32.4% for limited-service — useful context for where actual food cost typically lands industry-wide, though it’s a blend of well-run and poorly-run kitchens, not a target to aim for on its own.
Where the real gap hides — six places, not accounting errors
This is a different list from the one a spike-diagnosis exercise produces. A sudden jump in reported food cost is usually a data problem — a mistimed invoice, an unrecorded transfer, a stock valuation switch. A steady, structural gap between theoretical and actual is usually real, and usually hides in one of six places:
- Portion drift. A recipe specifies 150g; the ladle in practice delivers 165g. No single instance matters. Multiplied across a service, a season, a chain, it’s the single most common source of gap in operations that don’t scale-check regularly.
- Prep yield loss beyond the recipe’s built-in assumption. Every recipe already assumes some trim, some evaporation, some shrinkage during cooking — that’s what a correctly costed yield percentage accounts for. The gap appears when actual prep loses more than the recipe assumed: a duller knife, a less careful trim, a longer roast than specified.
- Waste and spoilage. Prepped product that goes unsold and gets thrown away. Commercial kitchens lose a real, measurable share of purchases this way: operational data aggregated by food-waste tracking platform Leanpath puts the average pre-consumer surplus rate at 4.2% of food purchases, with buffet and banquet-heavy operations running meaningfully higher.
- Over-production for buffets and banquets. Built-in insurance against running out becomes gap the moment the safety margin isn’t eaten.
- Staff meals, comps and manager’s discretion. Frequently under-tracked, sometimes not costed at all, and one of the easiest categories to lose visibility into as a group scales past one site.
- Receiving shortages and shrinkage. Short deliveries that don’t get flagged, breakage, and — yes — theft all land in this bucket. Estimates of total shrinkage as a share of revenue for food and bar operations commonly run in the 1–5% range; the widely repeated claim that a fixed, precise share of that is specifically theft doesn’t hold up to a primary source, so treat any single split between theft and other shrinkage with real skepticism.
How to actually close the gap
The gap only becomes actionable once both numbers exist, are computed independently, and are compared on a regular cadence — not just tracked as two separate reports that happen to sit in the same folder. Most operators running on spreadsheets and manual costing track actual food cost reasonably well, because it falls out of bookkeeping almost for free. Theoretical food cost is the harder half: it requires every recipe costed against current supplier prices, every yield accounted for, recalculated the moment an ingredient price or a recipe changes. Skip that half, and there’s nothing to compare actual against — which is exactly why so many kitchens only ever see the actual number and never learn where inside it the real loss lives.
Done properly, the payoff is real. Berg Hospitality Group — the Houston group behind B&B Butchers & Restaurant and The Annie Café & Bar — reported a 20.9% overall reduction in food cost after implementing recipe-level theoretical costing tools, averaging roughly a 3-point decrease per property. That’s not a rounding error; it’s the size of gap that sits undiscovered in a kitchen that never built the theoretical half of the comparison.
This isn’t the same problem as a sudden spike
If your food cost report jumped eight points in one period, this article isn’t the one you need first. A jump that size, in one period, is almost always a data problem, not a kitchen problem — a period cut-off, an unrecorded inter-site transfer, a stock valuation switch, a missing supplier credit. Audit the number before you audit the brigade; see our piece on phantom food cost spikes for the four places that kind of jump usually comes from. This piece is about the other pattern: the steady, structural gap that’s always been there, growing quietly, that only theoretical-vs-actual comparison ever surfaces.
How CalcMenu closes the loop
- Theoretical cost computed automatically — every recipe costed from current ingredient prices and defined yields, recalculated the moment either changes, no manual recosting cycle to fall behind on.
- Actual cost reconciled from real stock movement — opening, purchases and closing tied to the same recipes and the same period, not assembled by hand at month-end.
- Variance surfaced by dish, not just by kitchen — see which specific items are driving the gap instead of staring at one aggregate percentage with no way to act on it.
- The same discipline, every site — recipe cost accuracy is one of the three numbers worth being ruthless about at scale; see our piece on the three numbers that actually matter for why it outranks most of the KPIs a career roadmap tells you to chase.
CalcMenu doesn’t close the gap for you — a ladle still has to be checked, a trim still has to be trained. It makes sure the two numbers exist, update automatically, and point at the specific dish or site losing margin, instead of one blended percentage that tells you something is wrong without saying what.
Before you trust either number
Three questions worth asking before you treat theoretical or actual food cost as the truth:
- Do you have both numbers, computed independently, for the same period — or only the one that falls out of bookkeeping for free?
- Is your gap a steady few points, or did it jump suddenly? Those are different problems with different first moves.
- When the gap moves, can you tell which dish, which site or which category moved it — or only that the aggregate percentage changed?
If the honest answer to the first question is “we only really track actual,” the real food cost number your kitchen is running has never actually been measured — only guessed at, one bookkeeping cycle at a time.
Want to see your theoretical and actual food cost side by side, by dish, updated automatically? Book a free 15-minute call with our team — no commitment: Schedule a call.
Sources
- Restaurant operators kept food cost ratios in check in 2024 — National Restaurant Association
- Theoretical vs Actual report — Restaurant365 documentation
- Actual vs theoretical food costs — meez
- Closing the gap between actual and theoretical food costs — Restaurant365
- Food inventory and bar shrinkage — WISK.ai
- Food Waste Monitor methodology, foodservice — ReFED
Related sectors
Comments
Comments coming soon.